

Steward Redqueen
First a shared language, then a dashboard.
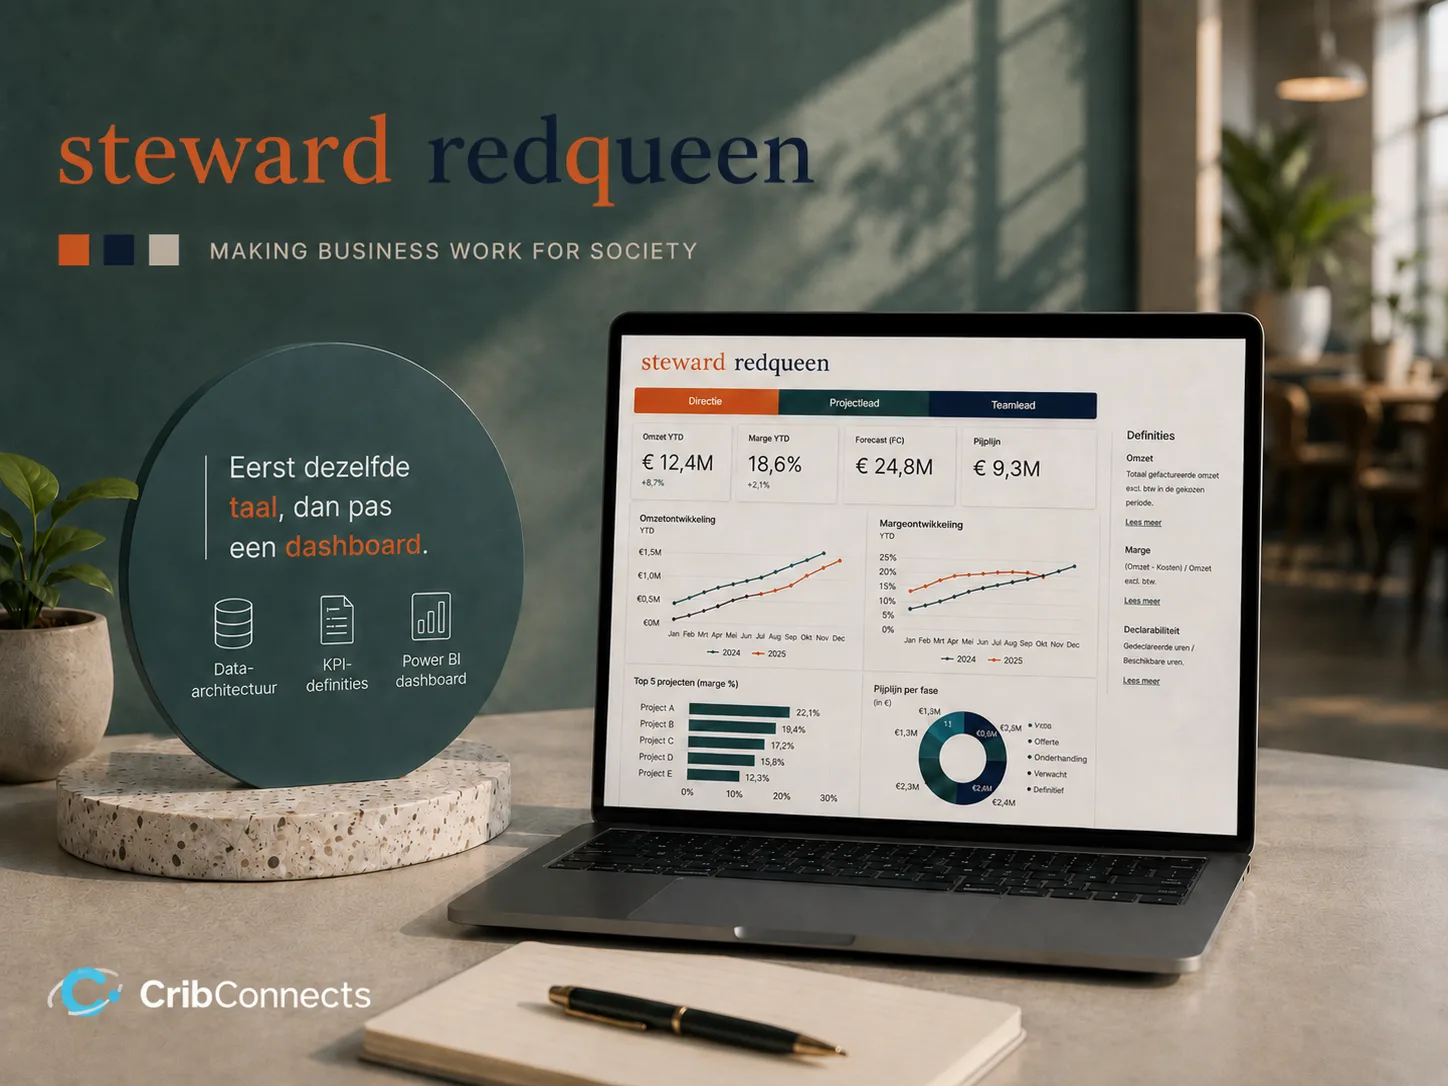
Meetings started with the question which version of the numbers was on the table. We pinned down the definitions, brought the scattered data together in one structured foundation and built a Power BI management dashboard on top, where leadership, project leads and team leads all see the same picture.
The situation.
Steward Redqueen works in projects with different teams. There were plenty of numbers, but they were scattered across loose exports and small reports. So meetings too often started with 'which version is this' instead of 'what do we do next'.
What they wanted: one place where everyone sees the same thing, so you can steer on revenue, margin, hours and progress without digging first.
What we found.
Loose exports, different definitions and small errors that only surfaced late. A lot of knowledge lived in people's heads. What was missing wasn't a tool, it was a foundation. A dashboard on top of scattered data and fuzzy definitions only gives you arguments in color.
What we did.
First we agreed on the language. What exactly do we mean by utilization, billability, project margin, budget versus actuals? For every KPI we recorded who owns it.
Then we put the data foundation in place. The loose sources were brought together in one structured model. That foundation is the real work you see reflected in the dashboard.
On top of it we built one management dashboard in Power BI with three perspectives:
- Leadership: revenue, margin, forecast, pipeline
- Project lead: budget versus actuals, hours per role, risks and actions
- Team lead: utilization, billability, absence and staffing for the coming weeks
Insights we now know are correct, and that the business can actually steer on.
How it landed.
The Monday morning meeting no longer started with collecting numbers. Leadership and project leads looked at the same tiles. One project heading for an overrun stood out immediately, and hours and scope could be adjusted on the spot.
What it delivered.
A structured data foundation that new questions can plug into. Less time spent on reporting, fewer misunderstandings about definitions, faster decisions and a clear view of where the hours leak away. The dashboard became the starting point of the week.
Time and team.
Six to eight weeks in short sprints. Finance, project leads and team leads at the table. CribConnects AI built the data foundation and the Power BI dashboard and delivered the short training.
Tell us where you stand.
Your vision, our expertise. We reply within one business day.
+ Get in touch